Elon Musk’s xAI Launches Grokipedia — A Real-Time, Truth-Seeking Rival to Wikipedia
Elon Musk’s xAI Launches Grokipedia — A Real-Time, Truth-Seeking Rival to Wikipedia
Elon Musk’s xAI just lobbed another moonshot into the information galaxy with Grokipedia — an artificial intelligence (AI)-fueled encyclopedia gunning to give Wikipedia a serious run for its hyperlinks. The platform doesn’t just store facts; Grok claims it hunts them down, checks their pulse, and edits them on the fly. Inside Grokipedia: Elon Musk’s ‘Maximum […]
Welcome to CoinFeedPro
Latest crypto news from key platforms. All in one place.
Todays Sentiment
Bullish
Latest news
Gemini’s XRP Price Prediction Puts $4.50 in Sight – Here’s Why PEPENODE Could Be Next 1000x Crypto
Quick Facts: 1️⃣ Gemini’s XRP price prediction suggests the token could surge to $4.50 after confirming a breakout from a descending triangle pattern. 2️⃣ In the long term, XRP could climb to $15, thanks to a major breakout from a multi-year consolidation pattern. 3️⃣ As $XRP gears up for its next leg, PEPENODE is emerging […]
Chinese Central Bank Warns Of Crypto Loopholes In Global Regulation
China’s central bank escalated its warning on stablecoins and reiterated a hard line against domestic crypto activity on Monday, with Governor Pan Gongsheng arguing that the rise of privately issued “virtual currencies”—particularly stablecoins—exposes gaps in global financial oversight and increases systemic fragility. Speaking at the opening of the 2025 Financial Street Forum in Beijing on […]
- NEWSBTC
Bitcoin Fear & Greed Index Returns To Neutral As BTC Breaks $115,000
Data shows the Bitcoin Fear & Greed Index has surged back into the neutral zone after the recovery rally in the cryptocurrency’s price. Bitcoin Fear & Greed Index Now Has A Value Of 51 The “Fear & Greed Index” refers to an indicator created by Alternative that measures the average sentiment present among traders in the Bitcoin and wider cryptocurrency markets. The metric uses the data of the following five factors to determine the investor mentality: trading volume, market cap dominance, volatility, social media sentiment, and Google Trends. The index uses a numerical scale running from zero to hundred for representing this sentiment. All values above 53 correspond to greed among the investors, while those below 47 to fear. The region between the two cutoffs naturally corresponds to a net neutral mentality. Related Reading: Nearly $360M In Crypto Shorts Squeezed As Bitcoin Recovers To $116,000 Now, here is how the current Bitcoin market sentiment is like, according to the Fear & Greed Index: As is visible above, the indicator has a value of 51, which suggests the trader sentiment is almost exactly in the balance right now. This is a notable change in market mood compared to just a few days ago. As displayed in the chart, the Fear & Greed Index was inside the fear zone during the past few days. The despair among the traders was a result of the bearish price action that BTC had recently faced. At one point, the indicator even fell to a low of 22, reflecting a state of “extreme fear.” This zone, which occurs below 25, corresponds to investors being the most bearish toward the market. There is a similar region for the greed side as well, called the “extreme greed,” situated above 75. Historically, the extreme sentiments have been quite significant for Bitcoin and other cryptocurrencies, as they are where major tops and bottoms have tended to form. The relationship has been an inverse one, however, meaning extreme fear is where bottoms form, while extreme greed facilitates tops. Since the extreme fear low earlier in the month, BTC has been on the way up, a potential indication that the contrarian signal of the sentiment may once again be in action. Related Reading: XRP Flashes TD Buy Signal: Start Of Fresh Rally? The cryptocurrency has extended its recovery in a sharp manner during the last couple of days, which may be a potential reason why the Fear & Greed Index has surged back to the neutral territory now. Though, for now, Bitcoin traders are still undecided on whether bullish action will follow next. It now remains to be seen whether they will embrace greed, or continue to be hesitant about the recovery. BTC Price At the time of writing, Bitcoin is floating around $114,900, up 3.6% over the last seven days. Featured image from Dall-E, Alternative.me, chart from TradingView.com
- NEWSBTC
Dogecoin (DOGE) Cools Off — Buyers Struggle To Sustain Recovery Above Key Levels
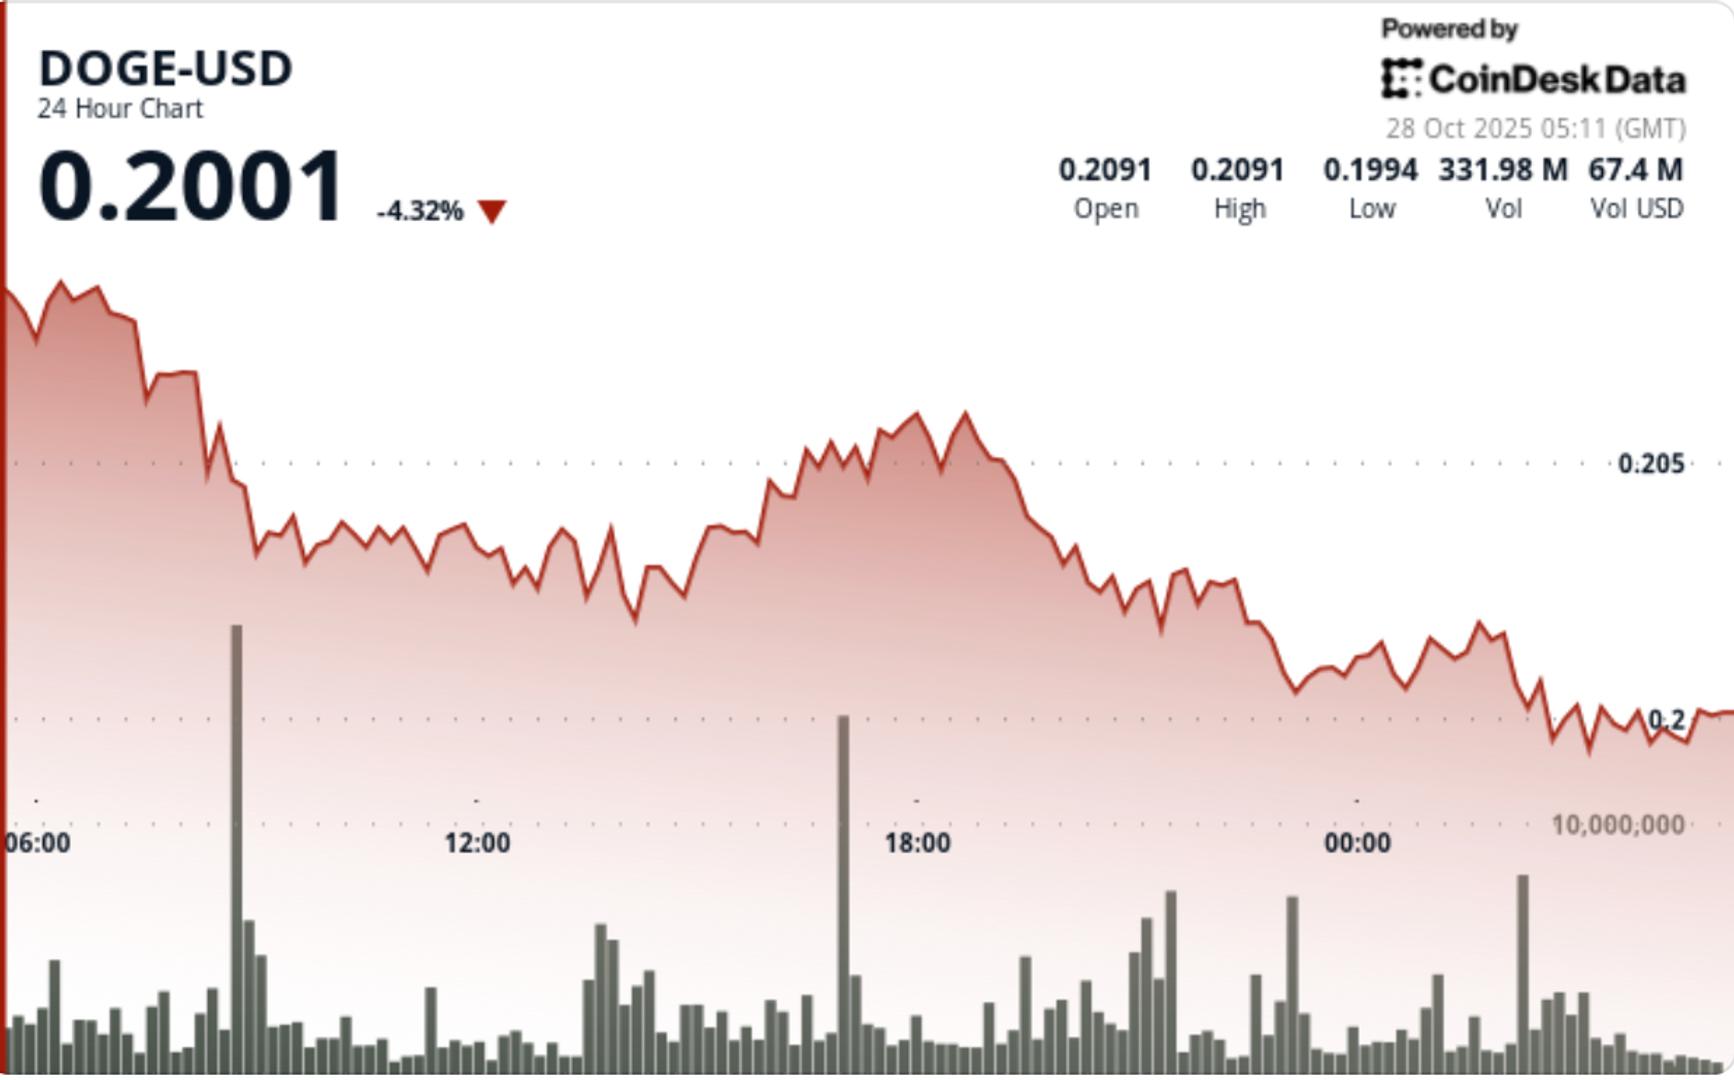
Dogecoin struggled to rise above $0.210 and corrected some gains against the US Dollar. DOGE is now consolidating and might decline below $0.1980. DOGE price started a fresh downside correction below $0.2035. The price is trading below the $0.20 level and the 100-hourly simple moving average. There was a break below a contracting triangle with support at $0.20 on the hourly chart of the DOGE/USD pair (data source from Kraken). The price could aim for a fresh increase if it remains stable above $0.1940. Dogecoin Price Starts Another Pullback Dogecoin price started a fresh increase after it settled above $0.1920, like Bitcoin and Ethereum. DOGE climbed above the $0.20 resistance to enter a positive zone. The bulls were able to push the price above $0.2020 and $0.2050. A high was formed at $0.2094 and the price is now correcting gains. There was a move below the 23.6% Fib retracement level of the upward move from the $0.1843 swing low to the $0.2094 high. Besides, there was a break below a contracting triangle with support at $0.20 on the hourly chart of the DOGE/USD pair. Dogecoin price is now trading below the $0.20 level and the 100-hourly simple moving average. If there is another increase, immediate resistance on the upside is near the $0.2020 level. The first major resistance for the bulls could be near the $0.2050 level. The next major resistance is near the $0.210 level. A close above the $0.210 resistance might send the price toward $0.2150. Any more gains might send the price toward $0.2250. The next major stop for the bulls might be $0.2320. More Losses In DOGE? If DOGE’s price fails to climb above the $0.2020 level, it could start a downside correction. Initial support on the downside is near the $0.1970 level and the 50% Fib retracement level of the upward move from the $0.1843 swing low to the $0.2094 high. The next major support is near the $0.1935 level. The main support sits at $0.190. If there is a downside break below the $0.190 support, the price could decline further. In the stated case, the price might slide toward the $0.1840 level or even $0.1780 in the near term. Technical Indicators Hourly MACD – The MACD for DOGE/USD is now gaining momentum in the bearish zone. Hourly RSI (Relative Strength Index) – The RSI for DOGE/USD is now below the 50 level. Major Support Levels – $0.1970 and $0.1935. Major Resistance Levels – $0.2020 and $0.2050.


